Tuesday, June 18, 2013

Market Update: It continues to look like a healthy correction

Last Thursday I wrote, "the S&P 500 could be carving out a trading range within 1600 and 1640. It is premature, admittedly, but early indications are 1600 is fairly firm support and 1640 looks to be the new resistance area."

Based on the hourly chart below, it certainly appears as if 1600-1640 has become the trading range for the S&P 500:

 Source: Finviz.com

Note that this correction continues to look healthy. The chart above depicts a double-bottom ("W") formation, typically a bullish occurrence.

Stepping back further, the S&P 500 daily chart also continues to look bullish:

Source: Stockcharts.com

As it has in the recent past, the 50-day moving average (blue line) appears to be firm support. Note the recent bullish breakout through the declining trend line. Also, both the MACD histogram and stochastic are rising off oversold levels and it's good to see the MACD lines have stayed above the zero threshold (bullish). Finally, the RSI has remained at or close to 50 during this correction, inferring positive momentum remains intact and no severe or lasting technical damage has occurred with this decline -- another bullish indication.

As I've been writing, so far so good regarding this correction....

Monday, June 17, 2013

Crude oil continues to look bullish

I have been bullish on crude oil for some time now. Since starting this blog in March, amongst the initial postings was an entry bluntly entitled, "Bullish Crude Oil Chart." And I've since written about how in my experience equities tend to lead their associated commodity. Given energy equities have been doing quite well, my expectation has been that crude oil will likewise do well.

The hourly chart below shows crude oil since I last posted on this subject in late May and earlier this month:

Source: Finviz.com

Price has remained in a solid uptrend, along the way undergoing periodic breakouts and retrenchments to the trend line -- very common and healthy action. Currently WTI is a bit extended in the short-term at $98 and change; another retrace is likely.

The daily chart also depicts a bullish picture:

 Source: Finviz.com

With this recent rally, crude has successfully broken out of a triangle formation.  $100 looks to be an area of potential resistance given it approximates last September's prior high and is also a nice round number (don't dismiss the importance of round numbers, review behavioral finance studies). Again, it wouldn't surprise me to see a pullback take place soon before a run at new highs occurs.

Friday, June 14, 2013

Gold is approaching a key inflection point

I last wrote about gold a month ago. Then I discussed how gold appeared to be following "the script," undergoing fairly typical price action following a severe sell-off. I concluded, "The price of gold should hold above the prior low level of approximately 1350 for the chart to remain constructive. It should build a base within this 1350-1400 range before looking to resume its ascent. However, if gold breaches the 1350 level and hits new lows, all bets are off as the next level off support appears to be around 1200."

Referring to the daily chart below, gold has indeed held above 1350 and has more or less been basing between 1350-1400 since mid-May.

Source: Stockcharts.com

More importantly, as shown in the chart above, gold is creating a triangle formation with its apex coming fairly soon. It's not quite a descending triangle since the triangle's lower line is not horizontal, thus forming a right triangle, but rather is rising even if just moderately. 

A breakout of this triangle should dictate price direction for the near future, but which way will gold break, up or down? Good question. Triangles are most often regarded as continuation patterns, meaning their eventual breakouts typically confirm the existing trend, and in this case one could argue gold's trend is down (pending on your time frame: short-term is down, but longer-term is still up).

That said I wanted to point out what appears to be a developing bullish divergence. Gold's price has been making higher lows since its low of about 1325 (intra-day) in mid-April, bottoming at around 1360 last month and currently looking to hold at the 1375 level. However, in looking at those lows, one can also just make a rough horizontal line that cuts across the 1365-1375 range since that third week in April. So you have a rough straight-across price line depicting lows, and yet note the RSI and MACD have been clearly rising in that time, setting up what can be considered a bullish divergence. I realize I've done a tad bit of massaging in this exercise, but I don't think it's excessive and very often in technical analysis perfection becomes the enemy of good.

As is always the case, price will ultimately shape my opinion. If the eventual triangle breakout is up, and meaningfully so, that would be bullish near-term. And vice versa for a breakout down, it would be bearish near-term. Stay tuned.

Thursday, June 13, 2013

Market Update: S&P 500 in short-term trading range

Last Wednesday, the morning of June 5th, I wrote, "I expect this recent correction to be short-lived, with the market most likely regrouping at the 1600-1620 level before making another run at prior highs." And the next day I wrote, "there are now enough price points to draw a lower-boundary declining trend line (blue) which indicates 1600 as support -- further confirming that round number that was arrived at due to 1) April's prior highs, and 2) the 50-day MA is approximately at 1600."

The S&P 500 did put in a bottom at 1600 on June 6th and rallied to about 1645 before rolling over.

Source: Finviz.com

The Index retreated all the way back to prior support at 1600 and is now attempting another rally. As shown in the hourly chart above, the S&P 500 could be carving out a trading range within 1600 and 1640. It is premature, admittedly, but early indications are 1600 is fairly firm support and 1640 looks to be the new resistance area.

If in fact the market (S&P 500) were to trade sideways within this 1600-1640 range, it would be a bullish occurrence and further bolster odds that this recent correction remains a healthy one. Better for the prior months of gains to get digested via traversing sideways then to correct with a more severe decline in prices. That said, as I wrote on June 6th, "1600 needs to hold in a meaningful way (meaning dips to 1598 or even 1595 are OK, often just shake-out moves). If 1600 is broken beyond just a minor, brief dip, my tune will almost certainly change."

Wednesday, June 12, 2013

How have technology stocks been doing?

In general, how have tech stocks been performing? As is always the case, much of the answer depends on your reference point.

Below I show the very popular Technology SPDR (XLK), both absolute and relative performance:

Source: Stockcharts.com

Wow, quite a difference in the two charts. The absolute performance of the XLK (upper inset) has remained in a nice uptrend since late last year. However, XLK's relative performance vs. the S&P 500 depicts a much more bearish picture, with relative return breaking down late last year and only recently successfully breaking through the declining trend line. Note also that relative return was able to break out in July 2011, long before absolute return was able to do so in January 2012. For me, relative return is the primary focus since I am expected to beat benchmarks.

Another way of viewing the tech sector -- or any sector for that matter -- is my preferred method, by using an equal-weighted ETF as opposed to market-weighted. The XLK is market-weighted meaning it's a top-heavy representation with larger-cap stocks having a greater influence on the ETF's return. An example of an equal-weighted sector representation is RYT, the Guggenheim Equal-Weight Technology ETF. The two ETFs have a similar number of holdings, the XLK with 77 stocks and the RYT with 71. However, as shown below, the top-10 stocks in the XLK comprise a whopping 63% of its weight, compared to the RYT with its top-10 holdings making up just 18% of its weight.
   
XLK
RYT


Source:
Bloomberg


The RYT being equal-weighted is a much flatter surrogate and in my opinion offers a truer depiction of how the entire tech sector is performing. 

Below I show the relative return (vs. S&P 500) of both the XLK and RYT.
 
Source: Stockcharts.com

As with the absolute vs. relative charts for the XLK, the relative return charts above are quite different. We've already discussed the relative return of the XLK (upper inset), with its multi-month downtrend recently broken to the upside. Yet consider the relative return of the RYT (lower inset), making a double-bottom last year, successfully breaking through its declining trend line last December, remaining in a solid uptrend and breaking out last month. 

So again, how have tech stocks been doing? Based on the XLK, up until the last few weeks, relative performance vs. the S&P 500 has been very poor for months. However, when considering the RYT, relative returns have been much better, with a low put in last November and a rising trend established since that time. All in all, I would say tech stocks have overall been performing quite nicely and prospects continue to look bullish.

Tuesday, June 11, 2013

A chart that keeps me up at night

Loyal readers of this blog know that I'm an avid follower of divergences. I realize there is a lag problem as they can develop over many weeks and months, making for a less-than-precise timing tool. One has to use other indicators to help nail down timing calls. Nonetheless, it's been my experience that divergences can often give ample warning for turning points and more often than not ignoring their potential implications is regretful.

The chart below shows the relative performance of the Morgan Stanley Cyclical Index versus Consumer Staples SPDR (XLP), and the S&P 500 (red line), going all the way back to 1999:

Source: Bloomberg

The relative return of cyclicals versus staples typically serves as a good surrogate for risk-on/risk-off, i.e. the risk appetite of investors. When the relative return line is rising, investors are more risk-seeking and it's bullish for the market; when the relative return line is declining, investors are increasingly risk averse and it's bearish for the market. 

As you can see in the chart, over time the relative return of cyclicals versus staples tends to track the S&P 500. Higher highs in the market (S&P 500) are usually met with higher highs in the cyclicals/staples relative return line, and vice verse regarding lows. In other words, confirmation is the norm.

However, there are times when the two diverge. I identify in the chart a few such occasions with orange lines. In 2000, the relative return line made lower highs as the S&P 500 climbed higher. In 2002-2003, the relative return line made higher lows as the S&P 500 made a lower low. In 2007, the relative return line made a lower high as the S&P 500 made a higher high. These divergences occurred around key market turning points.

Fast forward to our current situation. The S&P 500 is at news highs and yet the relative return line remains within a 2-year downtrend -- not good. 

Again, I fully appreciate that divergences can lag, but the longer they remain in place the more powerful the eventual outcome. Divergences can disappear with the gap gradually closing, thus negating its implication. But the longer the divergence remains in place, the more difficult to erase as there is too much ground to make up. 

To eliminate the divergence in this case, cyclicals have a long way to go by way of outperforming staples. A long way.

Friday, June 7, 2013

Crude oil developing massive triangle formation

Crude oil's weekly chart shows a fairly well-defined, colossal triangle formation:


Source: Finviz.com

What's interesting is after about five years in the making, the formation of the triangle's apex is near complete, meaning we will soon observe a breakout. As I've written recently, my expectation has been for crude oil to break higher from here given that energy equities have been performing well and in my experience equities tend to lead their associated commodity. 

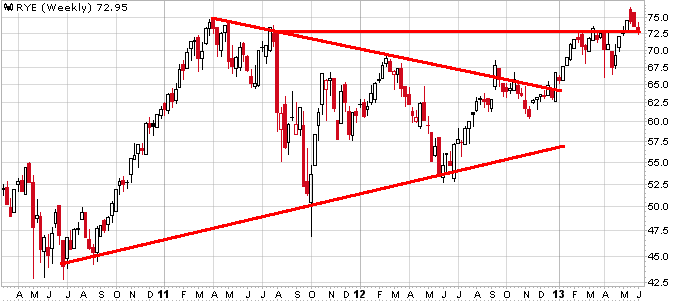
The weekly chart of the Guggenheim S&P 500 Equal-Weight Energy ETF looks bullish to me:

Source: Stockcharts.com

The ETF successfully broke out of a developing triangle earlier this year, and more recently has broken out again. Price has since retreated to the breakout level -- a fairly common and often healthy occurrence -- with $72 serving as support.

The above is an absolute price chart. How does RYE look relative to the market?

 Source: Stockcharts.com

The chart above is RYE vs. the equal-weight S&P 500 ETF (RSP) and as with the absolute chart, it appears bullish to me. Relative performance recently broke out of a triangle and ever since has been trending higher.

All in all, a bullish outlook for energy equities tends to be bullish for crude oil. Stay tuned.