The chart below shows the relative performance of the Morgan Stanley Cyclical Index versus Consumer Staples SPDR (XLP), and the S&P 500 (red line), going all the way back to 1999:

Source: Bloomberg
As you can see in the chart, over time the relative return of cyclicals versus staples tends to track the S&P 500. Higher highs in the market (S&P 500) are usually met with higher highs in the cyclicals/staples relative return line, and vice verse regarding lows. In other words, confirmation is the norm.
However, there are times when the two diverge. I identify in the chart a few such occasions with orange lines. In 2000, the relative return line made lower highs as the S&P 500 climbed higher. In 2002-2003, the relative return line made higher lows as the S&P 500 made a lower low. In 2007, the relative return line made a lower high as the S&P 500 made a higher high. These divergences occurred around key market turning points.
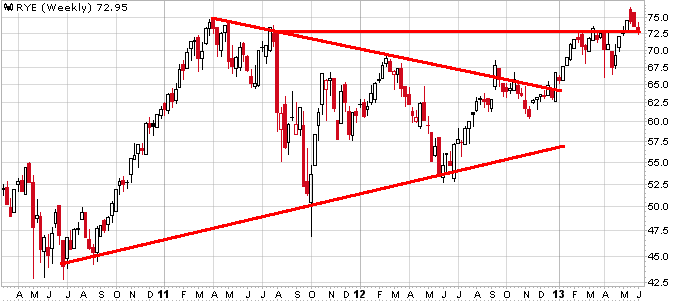
Fast forward to our current situation. The S&P 500 is at news highs and yet the relative return line remains within a 2-year downtrend -- not good.
Again, I fully appreciate that divergences can lag, but the longer they remain in place the more powerful the eventual outcome. Divergences can disappear with the gap gradually closing, thus negating its implication. But the longer the divergence remains in place, the more difficult to erase as there is too much ground to make up.
To eliminate the divergence in this case, cyclicals have a long way to go by way of outperforming staples. A long way.