Tuesday, April 30, 2013

What sector has performed the best since March 2009?

A classic case of truth is stranger than fiction. 

Source: Stockcharts.com

Needless to say, heading into 2009, as the market was reeling and the world was coming to an end, what was clear was 1) financial stocks were decimated, with many facing extinguishment, and 2) the consumer was likewise crushed, facing years of deleveraging and severely reduced spending. That said one would've understandably believed at the time that those stocks would be must-avoids as they would very likely underperform the market for years to come.

Wrong! Since March 2009, the best performing sector has been Consumer Discretionary, and the next best relative performer has been Financials.

As always, I'm sure there are many good reasons for why this has been the case (Fed policy, unprecedented valuations, etc.). However, for me it's just another example of the old saying that the stock market will do whatever it takes to prove the most people wrong. If it was that easy to surmise a no-brainer strategy based on the past, everyone would be a Warren Buffett. And in my experience, anything that appears to be a no-brainer when it comes to allocating one's funds should be re-evaluated, more than once. Nothing comes easy in this business and all too often the seemingly "No Duh!" investment decision is a setup for future losses.

Monday, April 29, 2013

10-year Yield & Small-caps Not Confirming Recent Market Rally

For the last several weeks, the 10-year T-bond yield has been declining as the stock market (S&P 500) has been rising or working sideways: 

Source: Bloomberg

Over time, T-bond yields tend to be positively correlated with the stock market:

Source: Bloomberg

In general, as the stock market rises, so too does the 10-year yield, and vice versa. There are a few good reasons for why this correlation should hold, one being rising T-bond yields infer the economy is strengthening. Typically low government bond yields are due in large part to the Fed keeping rates low for the benefit of an anemic or ailing economy. Signs of economic growth are going to make it less necessary for the Fed to maintain such low rates, in effect framing rising yields as a bullish indication for equities. Another reason rising yields are bullish for the stock market is very simple: it implies money is getting re-allocated out of bonds (yields rise) and most likely into equities. 

And yet as you can see in the first chart above, the 10-year yield is not confirming this recent rally in the stock market, a potential red-flag.

Also note that small-cap stocks likewise have not been confirming this recent S&P 500 move:

Source: Bloomberg

The Russell 2000 Index has been trending lower since mid-March, making lower highs as the S&P 500 made a new high and is trending higher. It doesn't always hold true, but more often than not one wants to see smaller-cap stocks confirm the move of larger-caps. An index like the S&P 500 is very top-heavy, reflecting the ups and downs of several mega-caps, whereas the Russell 2000 Index is a much flatter and more equal-weighted benchmark, offering a better representation of market breadth. Based on the chart above, the average stock is not doing as well as the S&P 500 would suggest -- another potential red-flag.

Friday, April 26, 2013

Eurozone Economy and Equities Seemingly Disconnected

I wrote about this topic earlier this month and it remains perplexing. Eurozone economic indicators continue to come in under consensus expectations as reflected by the Citigroup Economic Surprise Index, which continues to decline and is now well below zero at -77. Yet in that time Eurozone equities have simply traversed sideways and even more recently have rallied by more than 5%.

Source: Bloomberg

Considering a longer-term view (below), it would appear that if anything it’s not the first time for Eurozone equities to rise in the face of continued disappointing economic data. But it would also appear that eventually equities smell the rot and likewise decline.

Source: Bloomberg

I would also point out in the above chart that 1) the Citigroup Economic Surprise Index bottomed in January 2009, two months before equities bottomed, and 2) the recent decline in the Citi index has been massive, plunging from +76 at the end of February to its current -77, further conveying severe unexpected trouble for economies in the region. One would expect investors to be more concerned and yet the Euro Stoxx Index suggests otherwise.

Note that it’s not as if the ECB is doing anything to support equities, with its balance sheet remaining in shrink mode:

Source: Bloomberg

I continue to scratch my head. Hmm, maybe this has something to do with it.

Thursday, April 25, 2013

The recent plunge in gold was very strange....

I’m not one for conspiracy theories, but the recent climactic selloff in gold looks to be very strange. 

The chart below shows the gold lease rate versus gold. 

Source: Bloomberg

Historically, any time gold has made a precipitous decline, the gold lease rate has spiked up fairly abruptly and significantly. I’ve put yellow boxes around a few past examples. 

However, note the most recent plunge in gold, one the most compressed and painful drops ever for the metal. Given such a hard decline, one would expect the gold lease rate to have shot up through the roof. Yet the lease rate barely budged. In fact, that little rise you see in the lease rate occurred before gold fell off a cliff. In other words, when gold went from 1580 to 1360 in an eye-blink, the lease rate traversed sideways to slightly down. Very odd.

Granted, it's not as if I'm showing volumes of data from various sources, but the gold lease rate generally moves based on fundamental info and events. I can only assume with this recent gold plunge that 1) not much changed fundamentally to serve as a catalyst for the selloff, and 2) more likely key technical levels were breached which triggered many computer algos to dump gold shares. Given these algos are more or less highly correlated, they all fired at roughly the same time causing mass selling, which then likely set in place a selling feedback loop as price declines continued to break key levels. Such technically-induced selling can occur abruptly and for a time within a vacuum, until the unwinding exhausts itself and price finally settles at a (much) lower level, serving as new support. 

That's my guess. It's unfortunate but price action based on technicals is no longer just human-driven. Not by a long shot. And I suspect that hasn't been the case for quite some time.

Wednesday, April 24, 2013

We're Not Out of the Woods Yet

Since its peak on April 11, the S&P 500 declined by -3.2% through April 18 and has since rallied +2.5% off that low. Good sign? Are we on our way to a new high?

Frankly it's too early to tell. The chart below helps to explain why.

Source: Bloomberg

In the past, when the S&P 500 has made new highs (green boxes) and then corrected off those highs, any ensuing rally thereafter eventually rolled over (red arrows) with further declines to follow. 

That's not to say it will happen this time, and of course there have been times when the market has corrected off new highs only to later rally to another new high. My point is we're currently at a key point where the market can go either way: this rally fails like those in the past (red arrows), or presses higher and breaks through the former April 11 high. As I've written here, I remain bearish, expecting this current rally to roll over, however if the S&P 500 were to successfully break through its prior high, my tune will likely change.

Tuesday, April 23, 2013

Is Gold Following Expected Inflation?

As I wrote last week, following the climatic-type selling we saw in gold/silver, you typically get a reflex-rally that occurs out of the vacuum left by selling exhaustion. This rally is then met by further selling and a retrace ensues to the prior extreme low -- holding above this low (higher low) for it to be a bullish sign. The rally then continues and a double-bottom (W-shaped) is formed.

Note in the hourly futures chart for gold below, it shows what looks to be a W-shaped bottom forming.

Source: Finviz.com

However looking at the daily chart for gold, you can more clearly see the extensive technical damage inflicted on the metal:

Source: Finviz.com

Based on rough approximations in the above chart, the decline from 1550 to 1350 puts the 50% retrace at 1450, the half-way point often being where a rally rolls over. But the 1550 level itself, which as you can see above was prior support, has now become resistance or another headwind.

I would add that in the Fibonacci chart below, when considering gold’s high of 1795 last year and low bid of 1320 last week, the 50% retrace is 1558, or very close to that 1550 level.

Source: Bloomberg

The bottom line is 1) what we’re seeing occurring with the price of gold over the last several days is not surprising and is often what occurs after a big selloff, and 2) gold faces much overhead resistance from here. I would expect declining retracements off any rallies as these resistance levels are met and even broken – all part of the technical mending process.

As for expected inflation, I thought the charts below were interesting. The upper inset is gold and the lower is expected inflation based on 5yr5yr forward breakeven rates. In January, future inflation expectations broke down through the 2.90% level and continued to decline below the 2.80% level. At the same time, gold weakened but then finally broke down.

Source: Bloomberg

I’m not sure of the degree of correlation between this inflation metric and gold, but looking at the multi-year chart below, they do look positively correlated. Interesting to see the recent spike in expected inflation with gold’s recent rally.

Source: Bloomberg

Judging from history, as long as this 5yr5yr inflation trend remains down or declining, it's not good for gold. However, I believe the Fed has upped its target inflation rate from 2% to 3% and as I've shown before, we know the Fed's balance sheet continues to expand. That said I have to think Bernanke is keeping a close eye on this 5yr5yr inflation chart, definitely preferring that expected inflation reverts back to the 3% level -- which would be bullish for gold. 

But -- and it's a big "but" -- expected inflation had been declining since late January in conjunction with Fed balance sheet expansion going through the roof. Question: can the Fed do enough to get expected inflation back to the 3% level, or is it pushing on a string?

Thursday, April 18, 2013

Signs of Risk-Off Prevalent

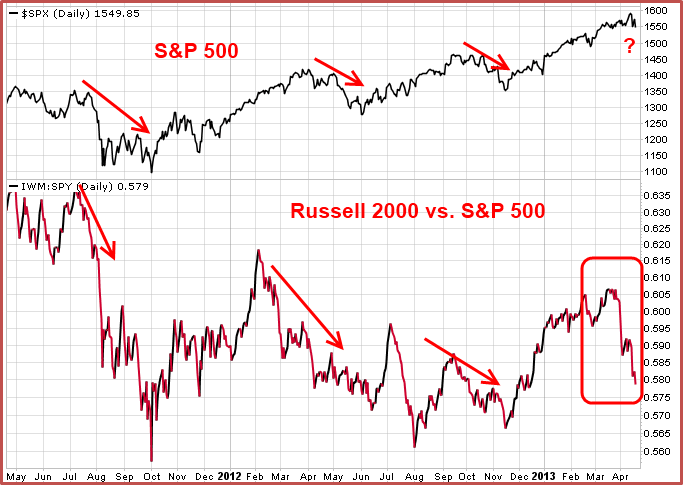
As I've written, I keep an eye on several indicators or metrics which help to gauge where we are on the risk-on/risk-off spectrum. Over the last few weeks, many of these have clearly been signaling that it's time to reign in risk and get more bearish.

The following chart shows the Russell 2000 Index versus the S&P 500 in the lower inset, and the S&P 500 in the upper inset.

Source: Stockcharts.com

When small-cap stocks begin to underperform larger-caps, it's a risk-off signal and as you can see small-cap performance has fallen off a cliff versus larger-caps.

Source: Stockcharts.com

The chart above shows high-yield "junk" bonds versus T-bonds. When high-yield bonds begin to underperform T-bonds, it's a risk-off signal and the relative performance of junk bonds broke trend last month.

Source: Stockcharts.com

I've discussed the above chart in the past. When cyclical stocks underperform staples, breaking through the 100-day moving average to the downside, it's a risk-off (sell) signal. A risk-off signal was generated late last month.

I've also discussed how mortgage REIT Annaly (NLY) has triggered a risk-off signal, and how the outperformance of health care stocks has not been a bullish sign for the market.

After being bullish since last September, color me bearish....