Thursday, November 7, 2013

FIVE Alive!

I also considered using "Five Below is Heading Up!" as a blog post title; I struggle with the titles. More importantly, the chart of Five Below (FIVE) looks terrific, exhibiting several bullish features.

Source: Stockcharts.com

The daily chart above shows FIVE carving out a triangle formation from April to July with a breakout occurring in July. Price then ran to just shy of the prior high at $42 only to retrench back to the lower boundary of the triangle. In September, price made a run in the first week of the month and then gapped up on very high volume to near $48, breaking out of both the triangle and prior highs at the $42 level. During the latter half of September and first half of October, shares of FIVE retraced about 50% of the gap up ("filling the gap") with a pennant formation eventually developing. Pennants are continuation patterns, meaning odds greatly favor the ensuing breakout to occur in the direction of the existing trend, in this case being up. The breakout in mid-October did indeed serve to continue the trend as the stock price climbed to near $50. FIVE traversed sideways for several days between $48-$50 and on Monday the stock once again broke out to new highs above the $50 level.

The relative chart portrays a similar picture:


The relative price of FIVE vs. SPY more clearly depicts a cup-and-handle formation including the breakout of the handle more recently -- all bullish.

I am obviously very bullish on the stock given the chart and technicals, but the CFA side of me also very much likes the fundamentals and growth drivers for the company. Five Below is a chain of stores that sells items for no more than $5. The company was founded in 2002, went public last year at $17, and now has over 250 stores. The primary audience for FIVE is the youth/teen market, affording the company no direct competitors. Its square footage growth and profitability metrics are some of the best in the retail industry. The company is expected to experience 25% annualized growth over the next several years with the target being 2000 stores nationwide.

I can't help but compare FIVE to its cousins, the dollar store stocks:


Over the last four years, DG, DLTR and FDO have easily surpassed the performance of the S&P 500. And up in Canada, Dollarama has simply blown away the performance of the TSX. My hope and expectation is that FIVE will do something similar to these stocks, if not better.

(Disclosure: I have owned FIVE and still do. I will report here before I sell, if and when I ever do.)

Wednesday, November 6, 2013

TSLA: Time to Sell

As they say, all good things must come to an end. After the close yesterday, Tesla (TSLA) reported what appeared to be better-than-expected earnings, but investors disagreed and the stock is off about 10% this morning. 

TSLA was the subject of one of my first posts on this blog, entitled "Tesla: Earnings, Smernings!" I highlighted several bullish items for TSLA, not to mention a classic breakout from a base on high volume. With periodic follow-on posts, trailing stops were discussed as being appropriate and prudent.

With today's action, I believe taking gains are in order.

Source: Stockcharts.com

The chart above highlights my April 4th bullish blog post (green circle) when the stock price was $44. TSLA soared to a peak of just beyond $190 before breaking the uptrend and working lower since late September. Note the 50-day MA was never breached until last month. I've also plotted the 10-day and 20-day MAs with the 10-day MA recently plunging through both the 20-day and 50-day MA, and the 20-day MA getting below the 50-day MA as well -- first-time occurrences since early April and clearly an indication of potential trend change (down). In addition, with the April breakout note the RSI (upper inset) remained above 50, frequently eclipsing 70, a bullish condition, and yet last month the RSI broke down through the 50 threshold and since then remained more/less sub-50 -- bearish.

With today's gap down in price, I wouldn't be surprised to see TSLA enjoy a brief relief rally. Such high-momentum stocks with great fanfare typically do not fall off a cliff overnight. Rather, during moments of abrupt and significant weakness, many view the price decline as an opportunity to enter the high-flyer stock at a steep discount, driving the share price north. But very often such a rally is anemic and fleeting as many holders who have ridden the stock higher for months (smart money?) look at this bounce-back in the stock as a good time to dump the shares given the previous gap down or weakness, and the stock resumes its descent. That doesn't have to happen in this case, obviously, and may not, but in my experience I've observed it happening quite often and I prefer to be on the side of prudence and risk control. One can always re-enter the stock, and frankly a relief rally doesn't have to occur at all and the stock could just head lower from here.

The bottom line is after what peaked at a 335% gain when the stock was hovering above $190, I would have no problem settling for "just" a 260% increase today. It should always be about discipline, risk control and letting the stock (i.e. price, volume, indicators) tell you when it wants to be sold.

Tuesday, November 5, 2013

Time for a pause?

In recent posts, I've been commenting that while the market outlook remains healthy, in the near-term some red flags or grey clouds (pick your color/noun) have been appearing, suggesting a reprieve or pause was in order. Such worrisome developments have not dissipated, but rather have grown in number.

Mind you, the daily chart of the S&P 500 shows a bullish uptrend:

Source: Stockcharts.com

The Index broke out of a rising wedge last month, an occurrence that is quite rare according to Tom Bulkowski's web site where he cites the breakout for rising wedges is down 69% of the time. Support now resides at the upper boundary of the wedge (1750), followed by the prior high of 1725 in September, and then the high in early August combined with the 50-day moving average, both at around 1700.

The hourly chart of the S&P 500 has me concerned:


Note during the rally in the latter half of last month, the rise went parabolic, with trend lines becoming increasingly steep. The ascent broke down on October 30th, followed by the Index trying to rally only to fail. Again, keep in mind this is an hourly chart with its implications being very near-term.

Other indications for an imminent pause include small-cap vs. large-cap performance:

Source: Stockcharts.com

In the chart above, the lower inset shows the IWM vs. SPY relative return and it recently broke an uptrend and has not been able to make a new high with the S&P 500 (upper inset). 

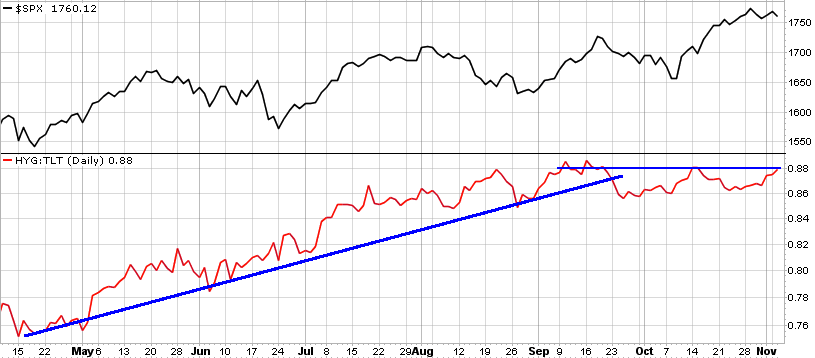
Another related indication is high-yield bonds vs. T-bonds:


The lower inset depicts the relative return of high-yield bonds vs. T-bonds with the uptrend broken in September and relative performance stalling, not yet confirming the stock market's new high. 

Finally, cyclicals vs. staples exhibits a similar picture:


The relative return of cyclical stocks vs. staples broke its uptrend last month and has yet to make a new high. 

In sum, all three risk-on/risk-off metrics (cap size, fixed-income quality, cyclical/non-cyclical equities) have not (yet) confirmed the S&P 500's new high, suggesting risk-off sentiment could be taking hold which would further suggest a pause is in the cards. A pullback to 1725 is a 2.5% correction from the peak, and to 1700 is 4% off the peak, nothing cataclysmic or overly alarming. And as I wrote in my last post, "the overbought condition can be worked off via time rather than price, meaning a sideways consolidation could do the job as opposed to a decline."

Friday, November 1, 2013

Is the market rally running out of steam?

In my post last Friday, while reiterating that the longer-term market outlook remained bullish in a clearly-defined uptrend, I did mention that some grey clouds were rolling in and a reprieve or pause in the advance would not be surprising. I specifically cited the weekly S&P 1500 New Highs-New Lows Percent, noting when it registered 20 or more it typically indicated an overbought condition with a pullback often ensuing. 

The following chart serves to further (grey) cloud the issue:

Source: Stockcharts.com

In the upper inset is the S&P 500 and in the lower is the 50-day moving average of NYSE stocks making new 52-week highs. Note the unsettling negative divergence. The S&P 500 has been making new highs and yet the 50-day MA of NYSE new highs is lagging, quite dramatically. It's normal for this indicator to be climbing out of a valley or low point when the S&P 500 is just establishing the first new high off an intermediate low (see late 2010 and late 2011 into early 2012, for example). However, YTD the S&P 500 has been in a steady uptrend populated by brief setbacks, and yet since March the 50-day smoothed NYSE new highs has been repressed and downtrending. Similar divergences occurred in 2007 and 2011 with the adverse repercussions to follow being severe. 

I'm not suggesting that we're headed for gloom-and-doom, to sell all stocks and move to cash. I always prefer to wait for price confirmation with regards to any developing divergence. Yet it goes without saying that this indicator bears close watching.

I thought I'd also show the following chart:


The lower inset shows a 10-day moving average of the NYSE up/down volume and in the upper inset is the S&P 500. By all accounts, this indicator appears to behave more as an overbought/oversold oscillator. When the 10-day MA up/down volume approaches 200, the market is extended and thereafter frequently consolidates or retraces, and vice versa at the -200 level. With the S&P 500's recent rally, this indicator has been heading south, further inferring a reprieve is imminent.

Assuming a short-term correction occurs, I would expect the next stop to be the 1700 level, more/less the area of prior highs. But the overbought condition can be worked off via time rather than price, meaning a sideways consolidation could do the job as opposed to a decline. Stay tuned.

Tuesday, October 29, 2013

Nikkei setting up to resume its rise

The Nikkei is setting up to resume its rise. The weekly chart below says it all:


Source: Stockcharts.com

After completing a double-bottom spanning four years, the Index broke out late last year, shooting up by 60+% in six months, and has since been carving out a classic pennant formation. Flags and pennants are continuation patterns, meaning they typically occur within a trend and resolve with the trend continuing -- in this case, the trend being up. Also, flags and pennants have high hit or success rates, i.e. odds greatly favor a continuation of the preexisting trend versus a reversal. That said I would expect the Nikkei to eventually break out and resume its ascent.

Some may question the rise in the Nikkei earlier this year wondering if it appeared to be parabolic and therefore climatic, with the pennant formation instead setting up for a fall. Leaving aside the aforementioned point that flags/pennants tend to be continuation patterns with high success rates, parabolic "blowoff" or climatic peaks typically occur after extended moves, occurring over many months or years. Think of late 1999, early 2000 for the U.S. stock market. To me this move in the Nikkei is still early.

Finally, the chart of the Yen is quite revealing:


Not surprisingly, a near-opposite picture of the Nikkei, with a pennant formation recently occurring within a downtrend -- next move should be down. Note the Yen is up against its 200-day moving average (red line), now resistance. Also, from 2010-2012, the Yen completed a massive bearish head-and-shoulders formation, breaching the neckline late last year.

With respect to these charts, clearly Japanese QE appears to be working.

Friday, October 25, 2013

Sunny skies, but some grey clouds are moving in....

The recent stock market advance has been a healthy one, meaning it has generally been confirmed by market internals and other such indicators.


Source: Stockcharts.com

The chart above shows that the S&P 500 Index has successfully broken through the rising trend channel as key moving averages remain upward sloping.

The NYSE A/D line, perhaps the most popular market internal measure, recently hit a new high, confirming the S&P 500's new high:

Source: Stockcharts.com

I remain bullish on the market, however I am a bit concerned about some potentially bearish signs that either have appeared or are developing. The chart below shows the weekly S&P 1500 New Highs-New Lows Percent (lower inset) with the S&P 500 (upper inset): 


When this percentage (new highs minus new lows divided by total issues) has surpassed 20 on a weekly basis, it has generally indicated that the market advance has become overbought and is due for a reprieve.

I've discussed in the past the relationship between the stock market and UST yields, namely that they tend to be positively correlated. A falling UST note is generally coupled with the stock market rising.


That said the chart above highlights an inverse head-and-shoulders pattern for the 10-year UST note. In isolation, this bullish formation does not bode well for equities. However, although this may be true in the near-term, I've also discussed in the past how the 10-year UST looks to be in the midst of a longer-term, complex head-and-shoulders breakdown.


The chart above highlights the bearish complex H&S formation with the neckline breakdown at 127-128. Also note the rolling 100-day correlation between the S&P 500 and the 10-year UST price -- over time they tend to have an inverse correlation. 

As I wrote in a prior post, "I do expect the neckline to hold and for the UST to roll over, however if the 10-year climbs through $127 meaningfully (beyond $128), it would require prompt reassessment with equities likely feeling the brunt of it." I stand by that statement.

Wednesday, October 23, 2013

Energy stocks, crude oil and the USD: they're out of synch

Yesterday I wrote about what appeared to be a shift in sector leadership, with energy stocks in particular showing strong signs of relative price emergence.


Just to elaborate on what I pointed out yesterday, the chart above shows the Guggenheim equal-weight energy ETF (RYE) vs. the equal-weight S&P 500 ETF (RSP). The relative performance for RYE exhibits a double-bottom pattern for April and July followed by a recent breakout of a triangle formation -- all bullish attributes.

However, crude oil (WTI) has been behaving quite differently of late.


Rather than heading north like energy stocks, the associated commodity has been heading south since the start of September. I have been bullish on crude oil for months and I remain so for a few reasons. For one, as shown in the chart above, crude oil (WTI) broke out of an ascending triangle in July, shot up beyond $105, peaking at $110, and has since given back all those gains. Note $110 appears to be resistance and $97 looks to be support. Currently WTI is about $98, recently falling below round-number $100, but still above support at $97. The bottom line is crude has not broken down and still qualifies as a pullback off an earlier bullish breakout.

Another reason I remain bullish on crude is the US dollar (USD). Earlier this month, I discussed my bearish take on the USD, including what appeared to be a complex head-and-shoulders formation with an already-breached neckline (important).


The chart above shows the head-and-shoulders pattern for the USD with the breakdown through the neckline at the 81 level. There appears to be support at 79, which could serve to stall the USD's descent, but to me this chart continues to look bearish.

As I've reminded here before, historically there has typically been an inverse correlation between the USD and commodities in general -- which includes crude oil.


The chart above shows crude oil (WTI) in the upper inset, the USD, followed by the rolling three-month correlation between the two. The inverse relationship is clear when observing crude oil's chart versus the USD, an approximate mirror reflection. Note the rolling three-month correlation has tended to be less than zero (negative) over time. What's interesting is when the correlation spikes into positive territory, especially when reaching 0.50 or higher. Such instances are rare and do not last long. Currently the rolling three-month correlation is 0.77, the highest reading since 2005. Both crude oil and the USD have been in-synch, declining together, but as displayed such a positive relationship is out of the norm and very likely to change imminently. The question is: which will rise and which will fall? I've already weighed in with my opinion, believing crude oil holds and eventually resumes its ascent as the USD continues to erode.

Finally, an additional reason I remain bullish on crude oil is due to another relationship I've discussed in the past.


Between energy equities and their associated commodity, crude oil, it's my experience that the equities tend to lead the commodity. That said, and viewing the exhibit above, I have to think crude oil will soon regain its footing and revert upwards. The chart of RYE has broken out of a massive ascending triangle and is hitting new highs. And yet crude oil has been weak and in decline, despite the strength in energy equities.

I would also point out that the rolling three-month correlation for energy equities and crude oil tends to be positive (not surprising), but as shown above, this correlation is currently at -0.59, registering a 10-year low. It's very unlikely energy stocks and crude oil will continue to move in opposite directions. But as with the USD and crude, the question is which will head higher or lower? Will energy stocks revert down with crude oil, or will the commodity hold and resume its upward trend (note in chart above, the rising trend (red line) for crude oil)?

As I've stated, experience and weight of the evidence suggests crude oil will hold and eventually rise, closing the divergence with energy stocks. Stay tuned.
(Source for all charts above: Stockcharts.com)